Production Monitoring for AI Agents
Turn traces, metrics, logs, and evaluations into selected production signals, thresholds, dashboards, and actionable alerts.
TL;DR
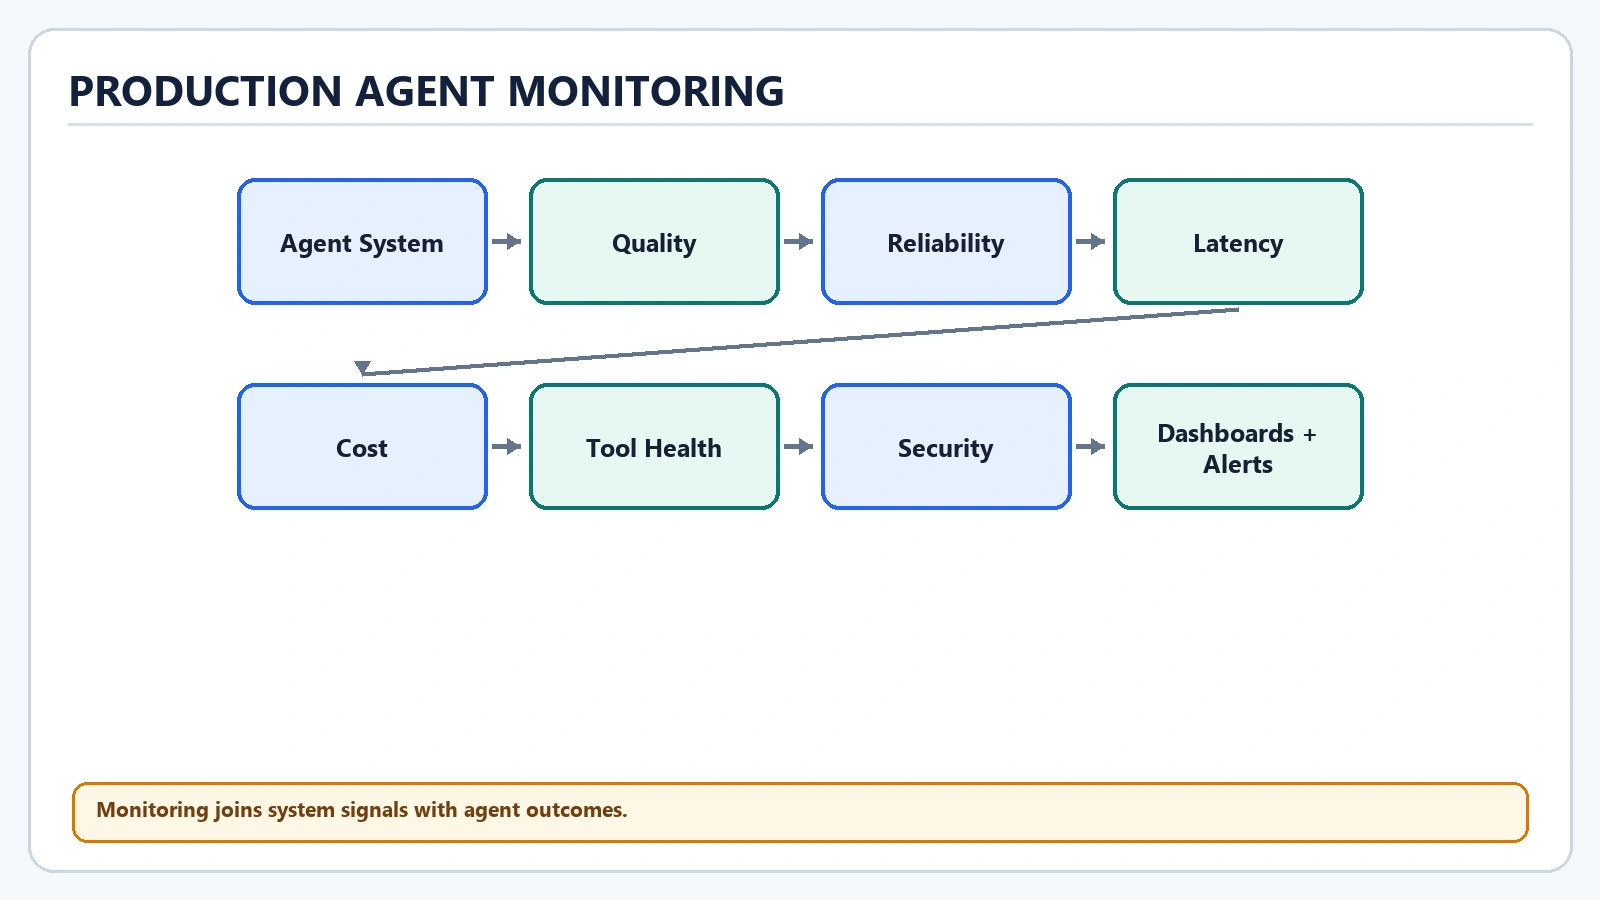
- Observability provides information for understanding behavior; monitoring continuously tracks chosen conditions that require attention. Agent monitoring must cover both system health and outcome quality. A healthy API that quickly produces wrong, unsafe, or abandoned tasks is not a healthy agent product.
- Start by making availability and task starts and task success and evaluation scores visible in the complete task path.
- Avoid the shortcut of monitoring only uptime; test the failure state before release.
- Judge the result with task success and failure and tail latency conceptually, not an isolated infrastructure number.
The production mental model
Observability provides information for understanding behavior; monitoring continuously tracks chosen conditions that require attention. Agent monitoring must cover both system health and outcome quality. A healthy API that quickly produces wrong, unsafe, or abandoned tasks is not a healthy agent product.
Keep five layers separate. Model optimization changes inference; agent optimization changes decisions and tool use; workflow optimization changes sequencing and recovery; infrastructure optimization changes capacity and execution; business optimization changes whether the result is worthwhile. For Production Monitoring for AI Agents, the most revealing evidence is usually task success and failure together with tail latency conceptually. That pairing prevents a local improvement from disguising a worse task outcome.
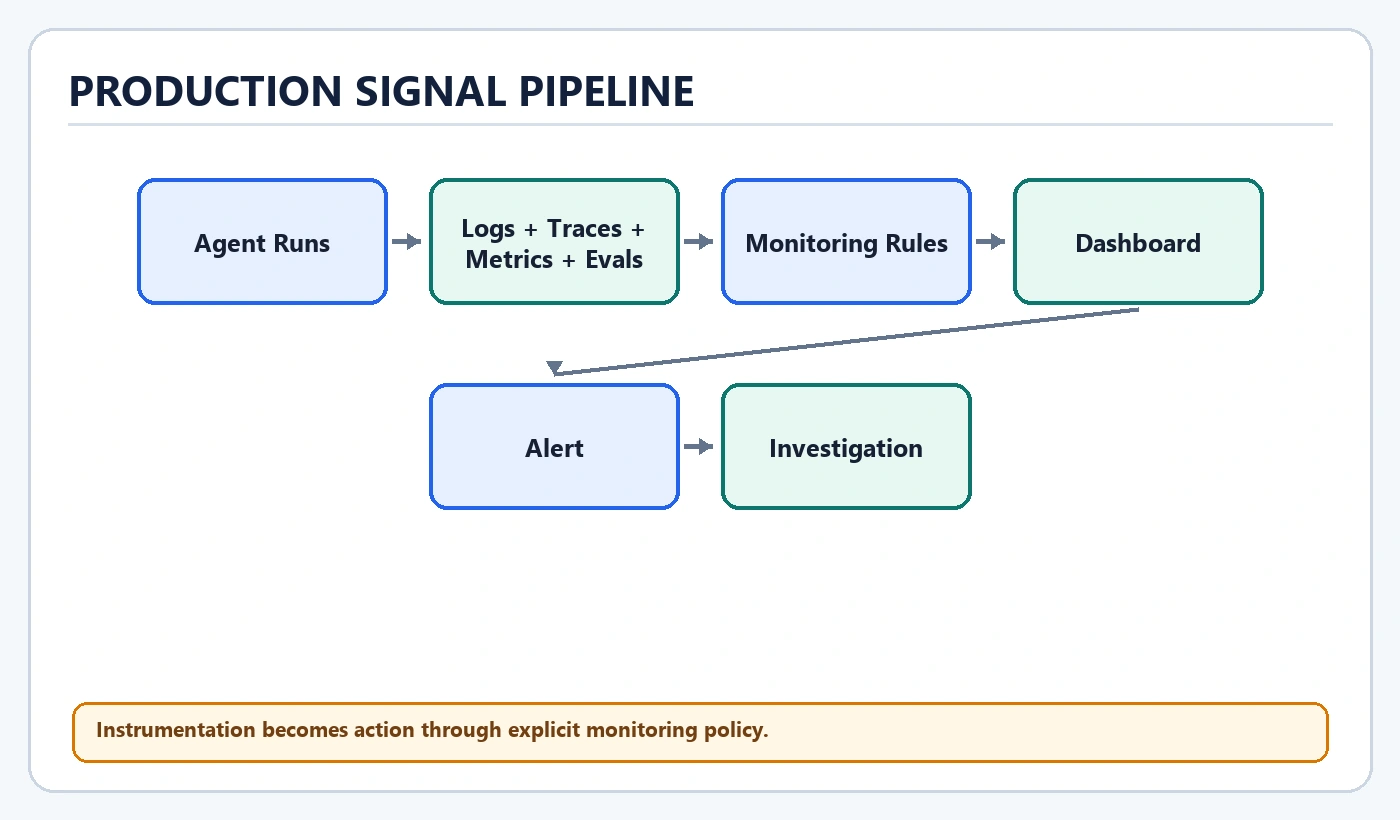
Instrumentation becomes action through explicit monitoring policy.
A concrete example
A production support agent dashboard can track successful task completion, end-to-end latency, tool failures, retries, cost per successful task, fallback use, and human escalation. Thresholds should come from service objectives and baselines rather than universal numbers. A rising queue age may require action before outright errors appear; one unusual trace may deserve investigation but not an urgent page.
The example is deliberately vendor-neutral. Exact provider limits, prices, model features, and service guarantees change; the durable design is to discover those values from the selected service, keep them in versioned configuration, and test the behavior that occurs when an assumption stops being true.
How the system works
- Availability and task starts. Trace it as part of the complete task so local improvements do not hide downstream cost or failure.
- Task success and evaluation scores. Give it an explicit owner, boundary, and failure result; implicit behavior becomes difficult to test.
- Tool errors, denial, timeout, and latency. Measure it by workload class because read-only, interactive, background, and side-effecting tasks have different constraints.
- Model latency, errors, usage, and fallback. Keep the mechanism deterministic where it enforces identity, authority, durability, or resource limits.
- Retries, loops, stuck tasks, and terminal states. Trace it as part of the complete task so local improvements do not hide downstream cost or failure.
- End-to-end latency, queue depth, and throughput. Give it an explicit owner, boundary, and failure result; implicit behavior becomes difficult to test.
- Token, tool, and task-level cost. Measure it by workload class because read-only, interactive, background, and side-effecting tasks have different constraints.
- Blocked actions and suspicious policy patterns. Keep the mechanism deterministic where it enforces identity, authority, durability, or resource limits.
- Human approval and escalation. Trace it as part of the complete task so local improvements do not hide downstream cost or failure.
- Ownership and response playbooks. Give it an explicit owner, boundary, and failure result; implicit behavior becomes difficult to test.
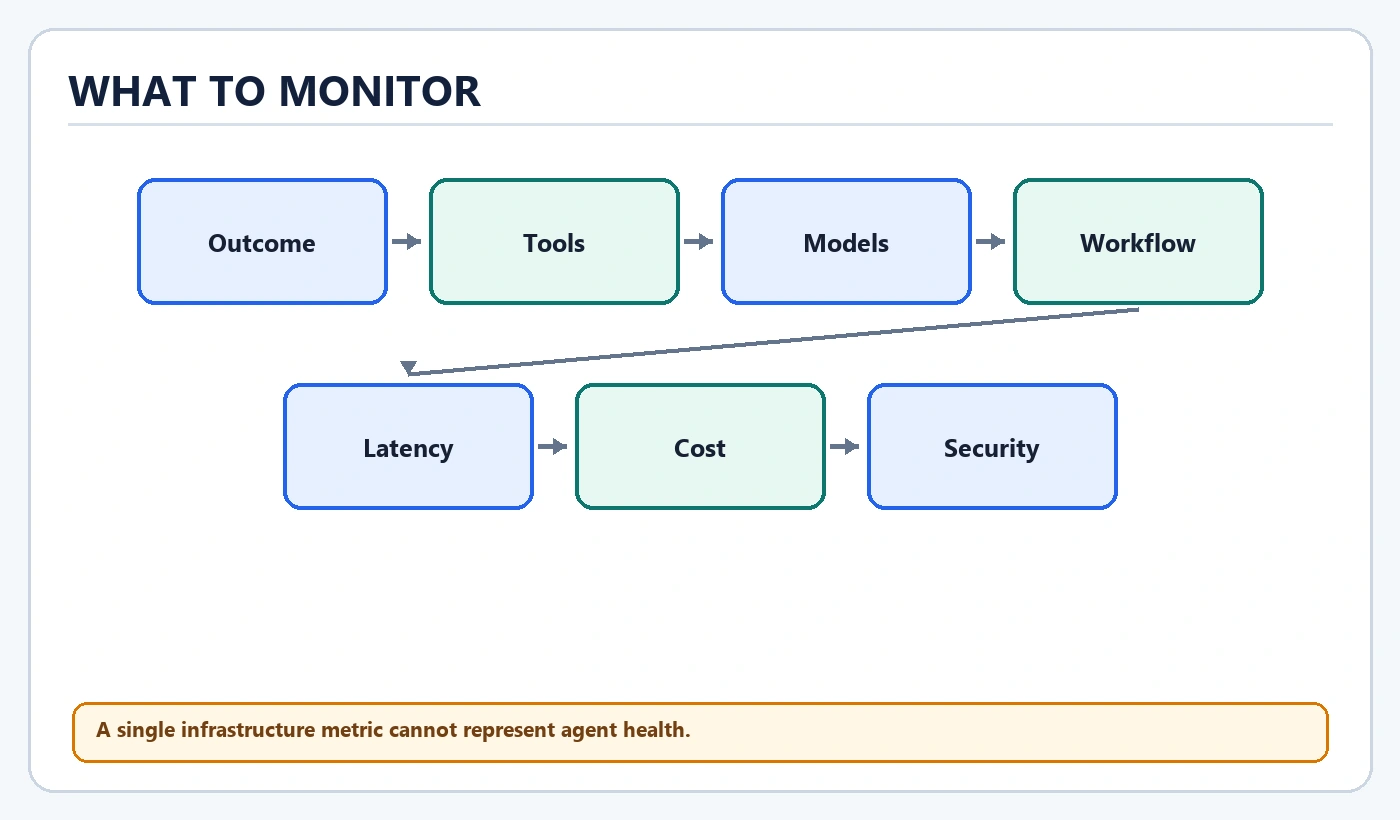
A single infrastructure metric cannot represent agent health.
A practical implementation path
1. Define user-visible success and critical journeys
Write down the current baseline and the evidence that would disprove the change. For this step, inspect tool errors, denial, timeout, and latency, watch task success and failure, and explicitly test monitoring only uptime. Record the assumption, owner, expected result, and safe terminal state so the team can distinguish a genuine improvement from work shifted elsewhere in the system.
2. Instrument runs with linked traces, logs, metrics, and evaluations
Place this responsibility in the component that can enforce it consistently. For this step, inspect model latency, errors, usage, and fallback, watch tail latency conceptually, and explicitly test alerting on every anomaly. Record the assumption, owner, expected result, and safe terminal state so the team can distinguish a genuine improvement from work shifted elsewhere in the system.
3. Choose a small set of outcome and system indicators
Version the decision so a run can be reconstructed after dependencies change. For this step, inspect retries, loops, stuck tasks, and terminal states, watch tool failure and retry rate, and explicitly test averages that hide tail behavior. Record the assumption, owner, expected result, and safe terminal state so the team can distinguish a genuine improvement from work shifted elsewhere in the system.
4. Establish baselines by task class and deployment version
Exercise the denied, unavailable, stale, duplicate, and unknown-result paths as applicable. For this step, inspect end-to-end latency, queue depth, and throughput, watch queue depth and task age, and explicitly test no task or tenant segmentation. Record the assumption, owner, expected result, and safe terminal state so the team can distinguish a genuine improvement from work shifted elsewhere in the system.
5. Set objectives and thresholds tied to operational consequence
Use a production-representative trajectory; an empty endpoint test misses accumulated agent behavior. For this step, inspect token, tool, and task-level cost, watch cost per successful task, and explicitly test dashboards with no owner. Record the assumption, owner, expected result, and safe terminal state so the team can distinguish a genuine improvement from work shifted elsewhere in the system.
6. Build dashboards that connect outcomes to tools, models, and workflow steps
Keep identity, permission, and resource limits outside model discretion. For this step, inspect blocked actions and suspicious policy patterns, watch fallback and escalation rate, and explicitly test assuming missing telemetry means health. Record the assumption, owner, expected result, and safe terminal state so the team can distinguish a genuine improvement from work shifted elsewhere in the system.
7. Alert only when timely human action can improve the outcome
Bound the work and define what happens when the bound is exhausted. For this step, inspect human approval and escalation, watch policy denial and blocked actions, and explicitly test confusing offline evaluation with live monitoring. Record the assumption, owner, expected result, and safe terminal state so the team can distinguish a genuine improvement from work shifted elsewhere in the system.
8. Attach owner, severity, context, and a runbook
Attach telemetry to the task and compare the result with the previous version. For this step, inspect ownership and response playbooks, watch task success and failure, and explicitly test monitoring only uptime. Record the assumption, owner, expected result, and safe terminal state so the team can distinguish a genuine improvement from work shifted elsewhere in the system.
9. Test alerts and missing-telemetry conditions
Roll out gradually when the decision can affect live users or external systems. For this step, inspect availability and task starts, watch tail latency conceptually, and explicitly test alerting on every anomaly. Record the assumption, owner, expected result, and safe terminal state so the team can distinguish a genuine improvement from work shifted elsewhere in the system.
10. Review noisy, unused, and blind monitoring regularly
Remove the mechanism if it adds burden without improving the intended outcome. For this step, inspect task success and evaluation scores, watch tool failure and retry rate, and explicitly test averages that hide tail behavior. Record the assumption, owner, expected result, and safe terminal state so the team can distinguish a genuine improvement from work shifted elsewhere in the system.
Failure modes and anti-patterns
These mistakes are attractive because they appear to simplify the happy path. They move complexity into incidents, duplicate work, wrong outcomes, or unexplained bills:
- monitoring only uptime
- alerting on every anomaly
- averages that hide tail behavior
- no task or tenant segmentation
- dashboards with no owner
- assuming missing telemetry means health
- confusing offline evaluation with live monitoring
Test each failure with the same seriousness as the successful path. Capture whether the system confirmed success, confirmed failure, returned a partial result, entered a degraded mode, or ended with an unknown external outcome. An unknown result must never be silently rewritten as success or treated as definitely safe to repeat.
Commonly confused concepts
| Concept | Meaning | Compared with | Meaning |
|---|---|---|---|
| Monitoring | tracks selected conditions continuously | Observability | provides evidence for understanding behavior |
| Evaluation | judges task behavior or quality | Monitoring | watches chosen results and operational signals |
| Metric | aggregated numeric signal | Trace | causal path through one execution |
| System health | runtime and dependencies function | Agent quality | outcomes meet the task standard |
The distinctions matter because each mechanism promises something different. A queue does not create capacity; a timeout does not prove an operation failed; a larger context does not guarantee relevance; and an alternate path does not become safe merely because the primary path is unavailable.
What to measure
- task success and failure
- tail latency conceptually
- tool failure and retry rate
- queue depth and task age
- cost per successful task
- fallback and escalation rate
- policy denial and blocked actions
Segment these signals by task type, deployment version, route, dependency, and tenant where appropriate. Averages alone can hide slow or failing task classes. Prefer cost and latency attached to successful, quality-checked outcomes. Use traces for causal investigation, metrics for trends, logs for discrete evidence, and production evaluations for behavioral quality. Do not invent a universal threshold: derive action levels from the service objective, baseline, consequence, and time available to respond.
When the complexity is unnecessary
A local, read-only experiment with public data and no durable workflow may not need the full machinery described here. For Production Monitoring for AI Agents, begin with the simplest observable path that can measure task success and failure. Add complexity when availability and task starts, task success and evaluation scores, or the consequences of monitoring only uptime create a concrete need. Simplicity is valuable only while it preserves the required outcome and makes failure visible.
Builder checklist
- Define the task, success evidence, and terminal failure states.
- Map availability and task starts, task success and evaluation scores, and tool errors, denial, timeout, and latency onto owned components.
- Rehearse monitoring only uptime and alerting on every anomaly before increasing exposure.
- Bound calls, tokens, retries, elapsed time, queueing, and external side effects.
- Verify important outcomes before reporting completion.
- Compare changes using production-representative evaluations.
- Monitor task success and failure beside tail latency conceptually.
- Maintain a clear fallback, escalation, or safe-stop path.
My Take
The strongest approach to Production Monitoring for AI Agents is to make its boundary measurable before making it clever. My default is to expose availability and task starts, attach it to task success and failure, and preserve a clear response to monitoring only uptime. That creates a system a team can improve deliberately instead of one that looks efficient only on its happy path.
Continue learning
- [Observability For Ai Agents](/observability-for-ai-agents/)
- [Agent Traces And Trajectories](/agent-traces-and-trajectories/)
- [How To Evaluate An Ai Agent](/how-to-evaluate-an-ai-agent/)
- [Deploying Ai Agents To Production](/deploying-ai-agents-to-production/)
- [Scaling Ai Agent Systems](/scaling-ai-agent-systems/)
Sources
These stable primary references support the standards and distributed-systems concepts used above; no current vendor pricing or product limits are asserted.