Agent Traces and Trajectories
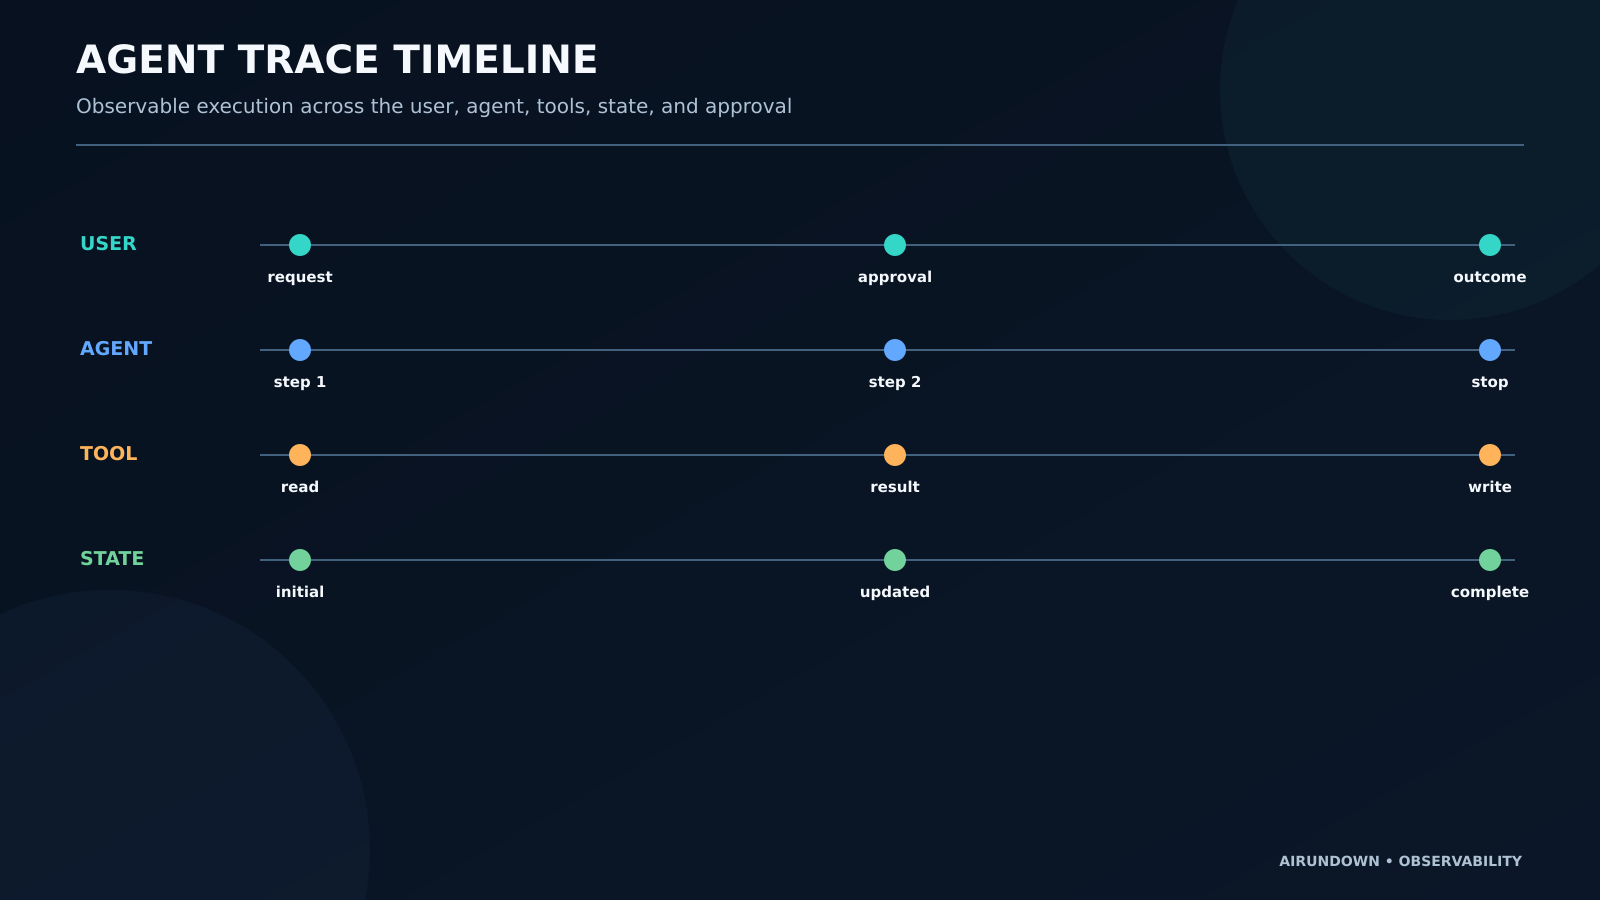
Traces record distributed execution; trajectories describe the observable path an agent took through that execution.
When an agent fails, the final response rarely explains why. The useful evidence is in the run: which model call proposed an action, which tool received what arguments, what the tool returned, how state changed, whether a person approved the next step, and where time was spent.
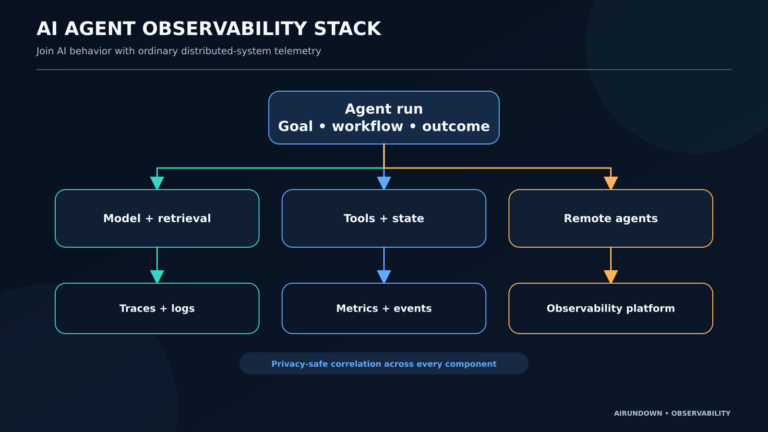
Agent traces and trajectories make that execution inspectable. They support debugging, evaluation, reliability analysis, security review, and auditability—without requiring collection of private chain-of-thought.
Run, trace, span, event, and trajectory
These terms are related but describe different things.
Run
A run is one logical execution of an agent or workflow. It begins with a trigger or task and ends in a terminal or suspended state. The run is a product-level concept and may contain one or more distributed traces.
Trace
A trace represents a request or operation as it moves through a distributed system. It is made of spans connected by parent-child or link relationships. A trace shows causality and timing across components such as an agent service, model provider, retriever, tool server, and sub-agent.
Span
A span represents one operation with a start time, duration, status, attributes, events, and relationships.
Examples:
agent.runmodel.generateretrieval.querytool.callapproval.waitagent.handoff
Names and attributes should follow stable conventions where available. The concept matters more than a vendor-specific screen.
Event
An event is a timestamped occurrence attached to a span or emitted as a standalone telemetry record. State changed, retry scheduled, approval granted, and stream interrupted are useful events.
Trajectory
An agent trajectory is the ordered sequence of observable states, actions, and observations that describes how the agent pursued its goal.
A simplified trajectory might be:
User request
→ inspect subscription
→ read cancellation policy
→ ask for approval
→ disable auto-renewal
→ verify final state
→ answer user
The trajectory is often derived from trace data, but it is an analytical view rather than a synonym for the whole telemetry object.
Trace versus trajectory
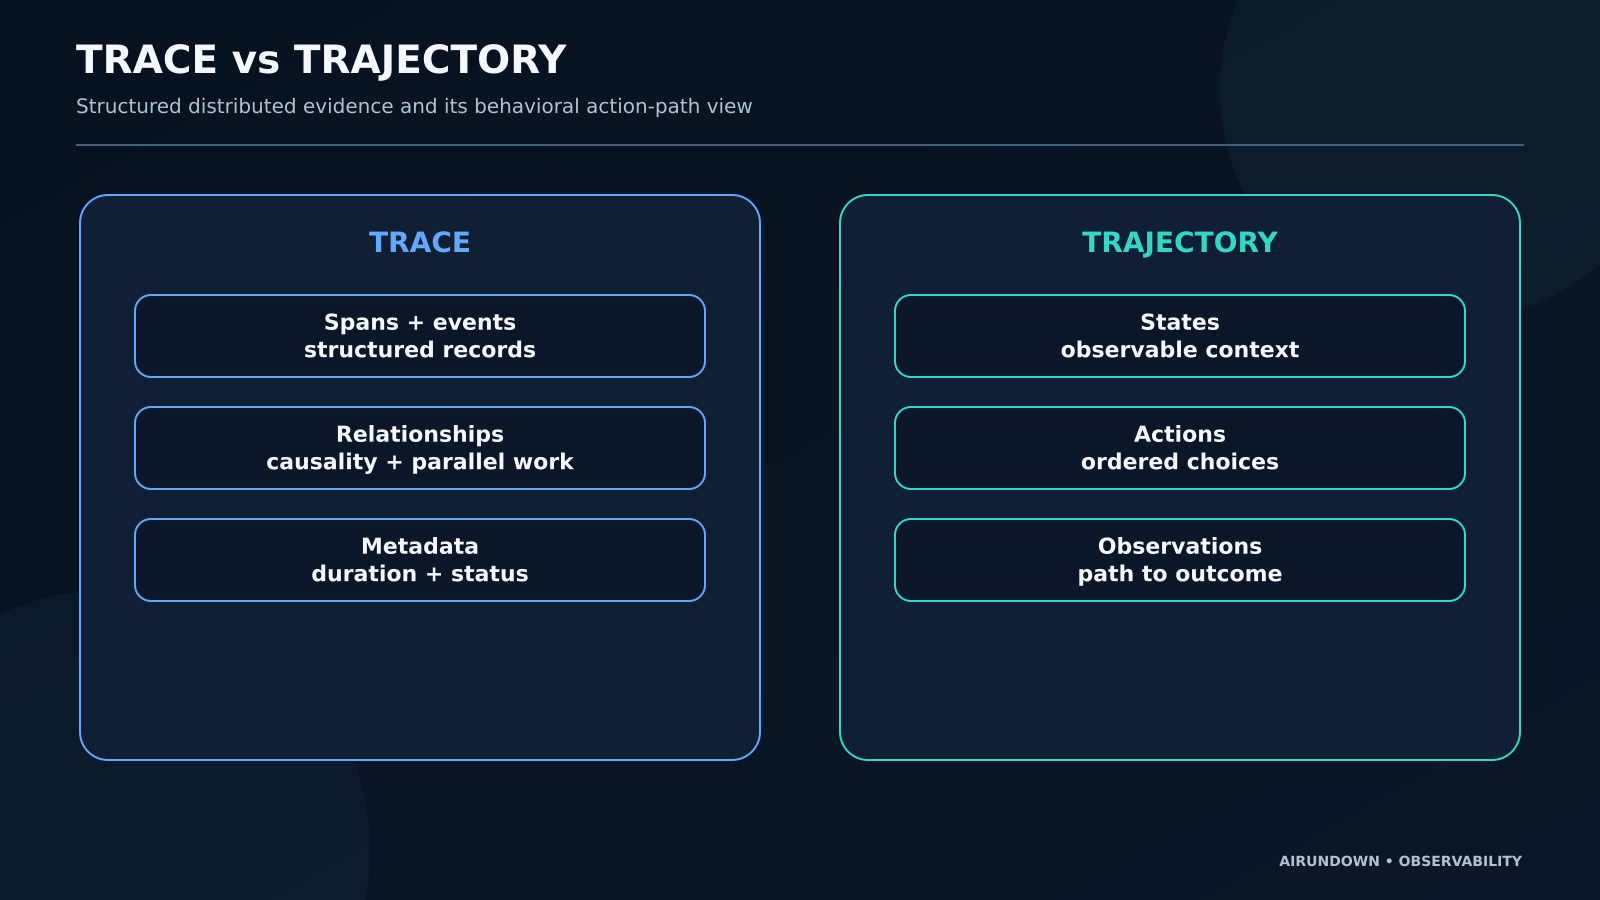
A trace preserves structure: service boundaries, parallel work, durations, nested calls, links, status, and attributes. It can show that a tool request spent 800 milliseconds in the MCP server and 6 seconds waiting for its database.
A trajectory emphasizes behavior: the agent chose search, observed no result, refined the query, asked a user, then called a write tool. It may omit infrastructure spans that do not affect behavioral evaluation.
One trace can yield several views:
- a behavior trajectory for evaluators;
- a latency waterfall for operators;
- a tool-use sequence for product analytics;
- an approval history for audit;
- an error chain for debugging.
Do not force every audience to consume raw spans.
A complete observable timeline
Consider a procurement agent reviewing a purchase request:
- The user requests approval for a laptop.
- The agent classifies the request.
- A retrieval operation loads the hardware policy.
- A tool checks the employee’s cost center.
- The agent notices the price exceeds the self-service limit.
- An approval request is sent to a manager.
- The run enters a waiting state.
- The manager approves.
- The agent calls the purchasing tool with an idempotency key.
- The tool creates order
PO-8821. - State is updated with the order identifier.
- The agent reports completion with the correct amount and delivery estimate.
The trace should make these observable without storing a private reasoning transcript. Record the classification result or selected action if it is part of the application, but do not require hidden internal thought.
What to record for each step
Useful agent-level attributes include:
- run and task identifiers;
- agent and workflow version;
- model and configuration identifier;
- step name and sequence;
- state transition;
- capability or tool identity;
- server, service, or remote-agent identity;
- input and output type;
- token and cost metadata;
- latency and status;
- retry, timeout, and cancellation state;
- approval requirement and decision;
- error category;
- result or artifact references.
Prefer stable IDs and bounded summaries over raw payloads. A document identifier and content hash may be enough to reproduce a retrieval decision without copying the entire document into telemetry.
Tool calls and observations
A tool-call span should identify:
- tool name and provider;
- validated argument metadata;
- target resource where safe;
- request attempt and idempotency key;
- authorization or approval outcome;
- start, end, and timeout;
- result type and size;
- error category;
- downstream correlation ID.
The observation is what the agent received from the environment. Preserve the distinction between:
- successful operation with an empty result;
- validation failure;
- permission denial;
- timeout with uncertain side effect;
- backend failure;
- malformed response.
Flattening all of them into tool_error destroys recovery information and weakens evaluation.
State transitions
State is central to agents because later actions depend on earlier observations.
Record important transitions such as:
status: running → waiting_for_approval
approval: pending → granted
subscription.renews: true → false
task: active → completed
For sensitive values, record a field name, version, or hash rather than the value itself. State snapshots should be bounded; indiscriminately copying the whole working memory into every span increases cost and privacy risk.
In graph-based agents, node entry, node exit, selected edge, and checkpoint identifier can make control flow understandable.
Retries and loops
Agents often repeat steps. A trace should distinguish:
- a deliberate refinement;
- a transient retry;
- a validation correction;
- an uncontrolled loop.
Record attempt numbers, retry cause, backoff, and budget. If three application layers retry independently, the trace can reveal amplification that ordinary error counts hide.
Trajectory metrics can include repeated action sequences, no-progress loops, time since last state change, and unnecessary tool calls. These signals help detect agents that appear active but are not advancing.
Handoffs and multi-agent work
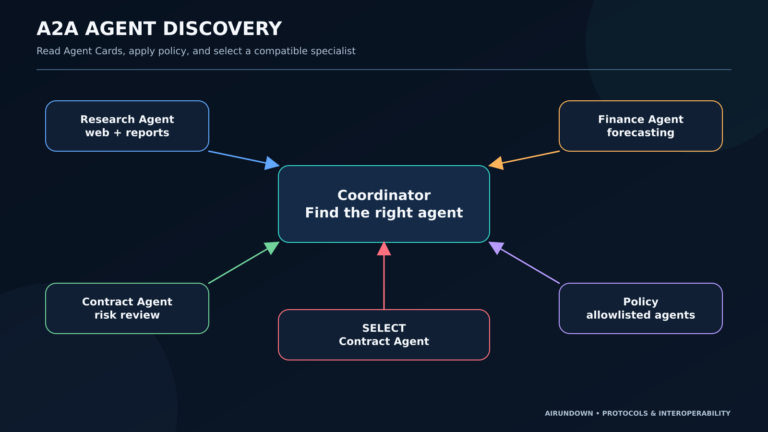
When a coordinator delegates to another agent, create a span or linked trace for the handoff. Record:
- sending and receiving agent identities;
- delegated goal;
- input artifact references;
- constraints and deadline;
- remote task identifier;
- status changes;
- returned artifact references;
- acceptance or rejection.
Cross-organization systems may not share one tracing backend. Use a safe correlation ID and span links rather than requiring the remote party to expose internal traces.
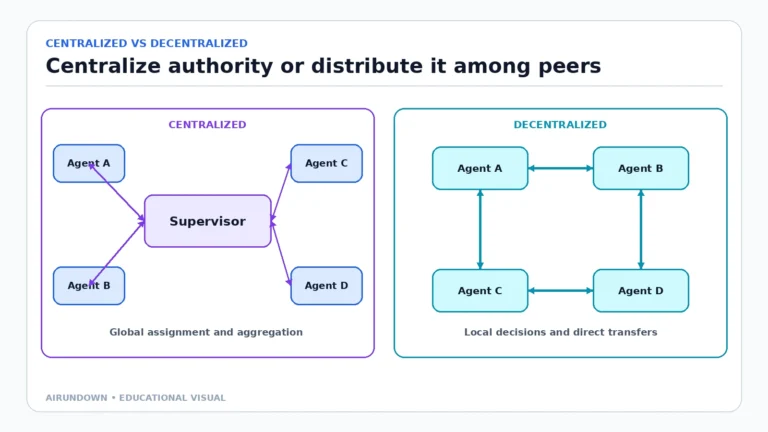
The coordinator’s trajectory can include “delegate to contract agent” and “receive risk report.” The specialist’s internal trajectory remains separately governed.
Parallel work and causality
A trajectory is not always a simple line. An agent may query three sources in parallel, start two specialists, or stream a response while a background task continues.
Traces represent this with sibling spans and links. An analytical trajectory can render parallel branches as grouped actions and define when they join.
Avoid ordering solely by completion timestamp. A slow child operation may start first but finish last. Parent-child relationships and explicit dependency edges provide better causality.
Traces for evaluation
Trajectory evaluation can check:
- the correct tool was selected;
- required context was retrieved;
- approval preceded the side effect;
- prohibited tools were absent;
- the agent verified the result;
- no duplicate write occurred;
- the run stopped after success;
- retries stayed within budget.
Do not require an exact golden trajectory unless only one sequence is valid. Express invariants and acceptable alternatives.
For example, retrieving account state before policy may be equivalent to retrieving policy before account state. Both must occur before a cancellation decision, and approval must occur before the write.
Traces for debugging
A final answer such as “I couldn’t complete that” is not diagnostic. The trace may show:
- model selected the right tool;
- arguments passed schema validation;
- server authorization succeeded;
- backend timed out;
- host retried twice;
- third attempt succeeded after the user-facing timeout.
That is a very different fix from prompt tuning. The trace assigns the failure to the dependency and reveals an uncertain outcome.
High-cardinality dimensions—run ID, tool name, model, server, policy version, error category—make it possible to compare failures without reading every payload.
Traces for audit
Audit questions include:
- Who initiated the task?
- What action was proposed?
- Which policy applied?
- Who approved it?
- What protected resource changed?
- What was the outcome?
A trace can contribute evidence, but an observability system is not automatically a compliant audit system. Important records may need immutability, longer retention, stricter access, and a legally defined schema.
Privacy, security, and retention
Agent telemetry can contain personal data, secrets, documents, and proprietary prompts. Apply:
- data minimization;
- field-level allowlists;
- credential and token redaction;
- prompt and result sampling;
- tenant isolation;
- encryption;
- role-based access;
- retention limits;
- deletion and legal-hold policy;
- separate handling for audit records.
Prompt injection can also target logs or operator tooling. Treat captured external content as untrusted and render it safely.
Do not put chain-of-thought collection on the critical path. Observable inputs, outputs, actions, tool results, state transitions, and decisions are enough for most operational and evaluation needs.
Sampling and cost
Full traces are valuable for development and high-risk workflows, but expensive at scale. A layered strategy can keep:
- metrics for every run;
- core span metadata for every run;
- sampled payloads for ordinary successes;
- full permitted evidence for failures;
- full evidence for high-risk or audited actions.
Tail-based sampling can retain slow or failed traces after their outcome is known. Ensure sampling does not systematically remove rare safety failures.
A minimal trace design
Start with:
- one root span per agent run;
- child spans for model, retrieval, tool, approval, and handoff operations;
- task, agent, and version attributes;
- structured status and error category;
- events for state transitions and retries;
- token, latency, and cost measures;
- safe links to final artifacts and environment state.
Then add fields only when they answer a real debugging, evaluation, monitoring, or audit question.
Common mistakes
- Treating a transcript as a trace.
- Treating a trace as hidden reasoning.
- Logging every payload without a privacy model.
- Recording tool names but not server provenance.
- Omitting state changes and approval events.
- Losing parent-child relationships during async work.
- Requiring one exact golden trajectory.
- Combining permission denials with transient errors.
- Sampling away all failed or high-risk runs.
- Using observability storage as an audit system without review.
My Take
The best trace is not the one with the most text. It is the one that can reconstruct the agent’s observable contract: what task it received, what it did, which systems it touched, how state changed, what was approved, and what outcome occurred.
Trajectories make that evidence legible as behavior. Traces preserve the distributed-system truth underneath. Keep both views, and teams can evaluate the agent without losing the operational cause of a failure—or demanding access to reasoning that should remain private.