Observability for AI Agents
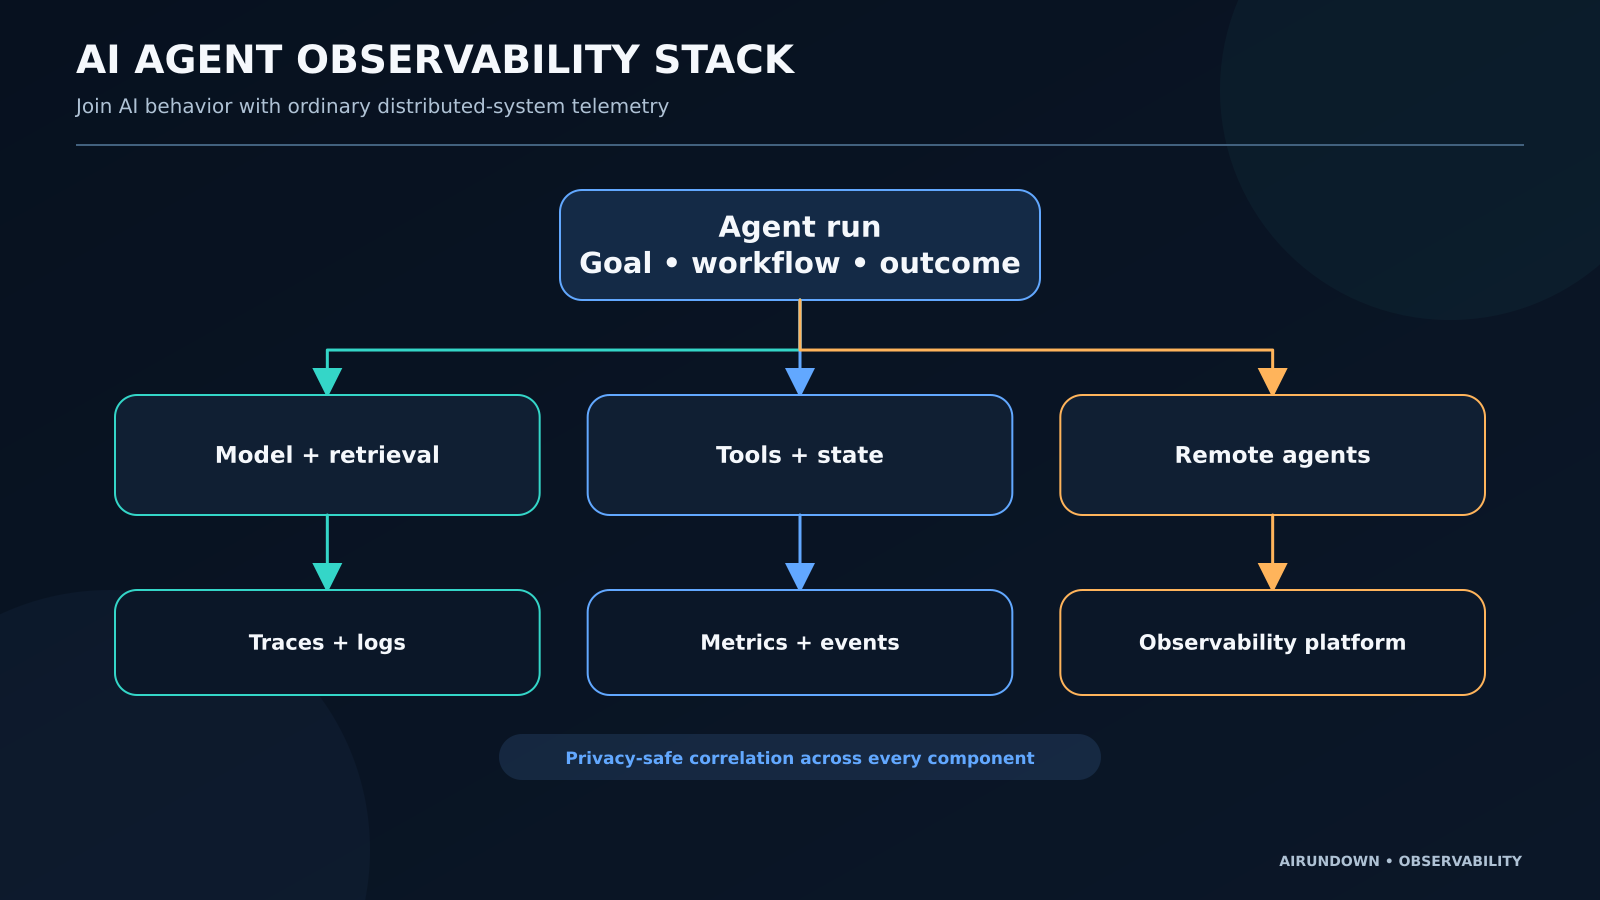
Observe the agent as both a goal-directed system and a distributed application.
Traditional services are observed through logs, metrics, and traces. AI agents need those same signals, plus evidence about model calls, retrieval, tool use, state, handoffs, approval, and outcomes.
The goal is not to record every token. It is to answer operational questions:
- Did the agent complete the user’s task?
- Which step failed?
- Why was the run slow or expensive?
- Did it use the right data and tools?
- Was a consequential action approved?
- Is behavior degrading after a model, prompt, or tool change?
Agent observability makes those questions answerable while respecting privacy and security boundaries.
Observability, monitoring, evaluation, and audit
These practices overlap but serve different decisions.
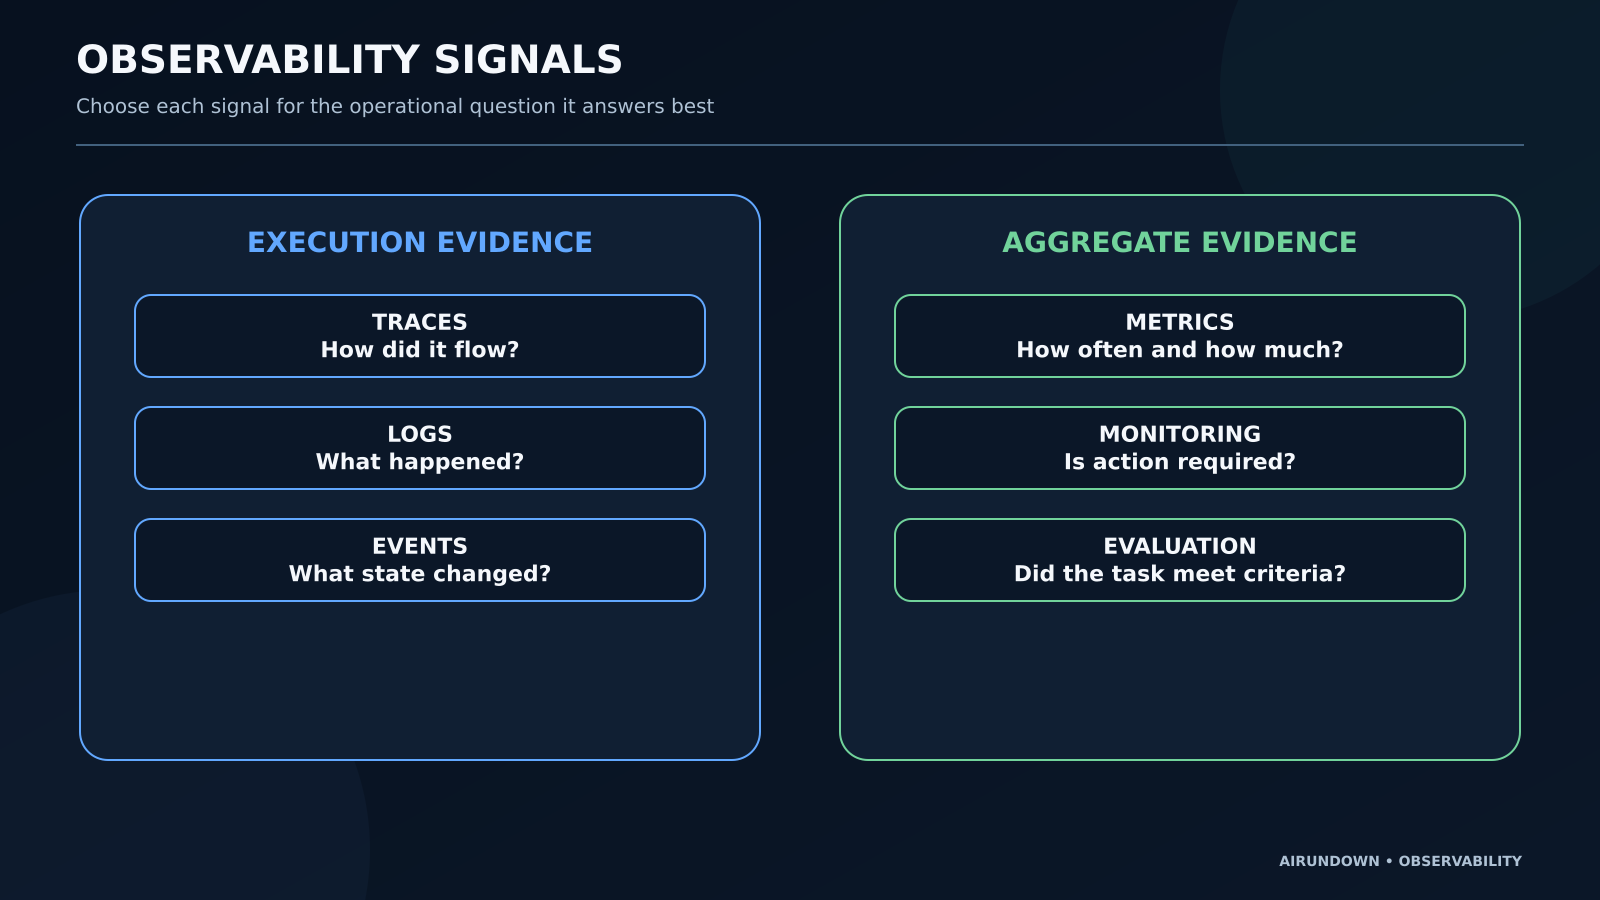
Observability produces evidence that lets operators understand internal behavior from system outputs such as traces, logs, metrics, and events.
Monitoring continuously checks selected indicators and alerts when thresholds or anomalies occur.
Evaluation applies task-specific criteria to runs or datasets to judge quality, safety, and success.
Audit creates durable evidence for accountability, policy, or legal review.
One trace can support all four, but their storage, retention, access, and guarantees may differ. An observability backend is not automatically a compliant audit log, and an evaluation score is not a health alert.
The layers to observe
Agent behavior spans several layers:
User and application
Capture the product task, authenticated context, workflow version, user-visible status, approval interactions, and final result.
Agent and orchestration
Capture step names, control-flow choices, state transitions, retries, stopping, handoffs, and task outcome.
Model
Capture provider and model identifier, timing, token usage, response status, structured-output validity, and safe request/response references where permitted.
Retrieval
Capture query, index and version, filters, document identifiers, ranking metadata, latency, and result count. Full content is rarely needed in every span.
Tools and protocols
Capture capability name, server or service identity, validated arguments or bounded summaries, permission and approval decisions, timing, result type, side effects, and errors.
Other agents
Capture recipient identity, delegated goal, remote task ID, status, artifact references, timeout, and return.
Infrastructure
Capture ordinary service dependencies: queues, databases, caches, networks, CPU, memory, and deployment versions.
Agent observability is strongest when these layers share correlation and conventions.
Select the right signal
Traces show execution flow
Use traces to follow one run across model, retrieval, tools, and agents. Parent-child relationships reveal causality and parallel work. Span duration shows where time was spent.
Metrics show aggregate behavior
Use metrics for rates, quantities, and distributions:
- task success rate;
- error rate by component;
- p50, p95, and p99 latency;
- token and tool cost;
- calls per successful task;
- retry and timeout rate;
- approval wait time;
- escalation rate;
- active and queued tasks.
Metrics power dashboards and alerts without storing every payload.
Logs explain discrete details
Use structured logs for important messages and diagnostics that do not fit span attributes. Include correlation IDs and stable fields. Avoid unstructured prose as the only record of a failure.
Events record important state changes
Examples include approval.requested, approval.granted, task.suspended, retry.scheduled, handoff.accepted, and artifact.created.
Events make asynchronous behavior visible and can feed both traces and audit pipelines.
A cross-component execution trace
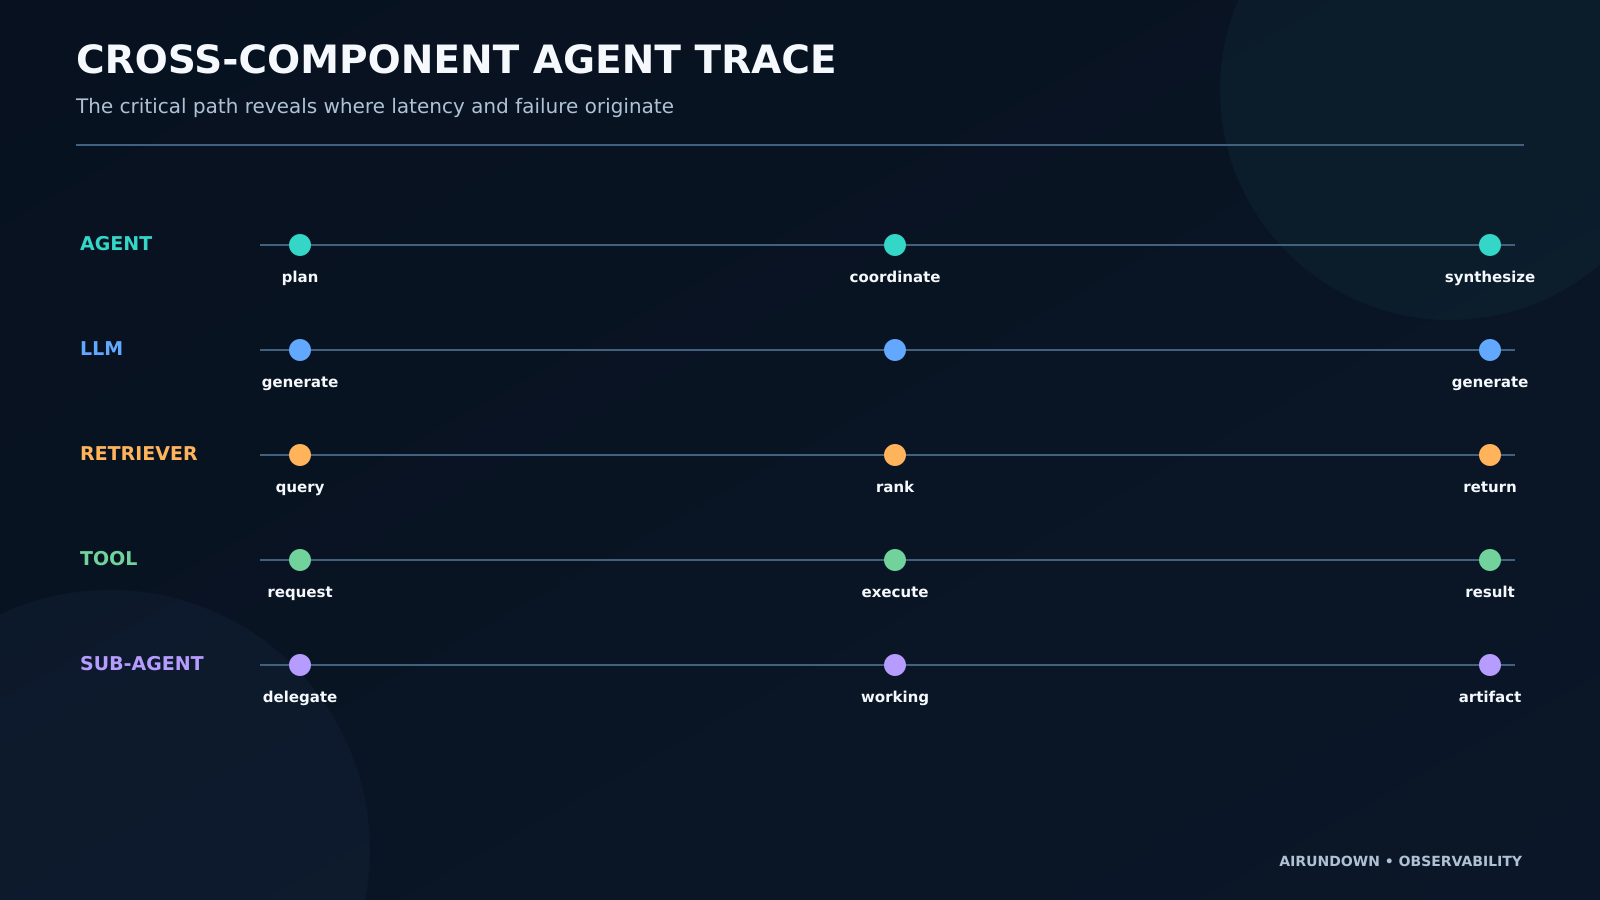
Imagine a research agent:
- The agent calls a model to plan.
- It queries a document index.
- It calls a financial-data tool.
- It delegates market context to a specialist agent.
- The specialist returns an artifact.
- The agent calls a model to synthesize the report.
A user sees a 24-second wait. The trace shows the initial model took 1.2 seconds, retrieval 600 milliseconds, the financial tool 2 seconds, the specialist 17 seconds, and final synthesis 3 seconds.
Without the trace, a team might optimize the model. With it, the specialist dependency is the clear latency owner.
Establish correlation
Create stable identifiers for:
- product task or workflow;
- agent run;
- distributed trace;
- user session where appropriate;
- tool operation;
- remote task;
- generated artifact;
- evaluation case in test environments.
Do not use a sensitive customer value as an identifier. Use opaque IDs and store protected mappings under appropriate access control.
Propagate trace context through ordinary services and supported protocol metadata where safe. Across trust domains, use a correlation reference or span link if full context propagation is inappropriate.
Define an agent span model
A useful root span can represent the complete agent run. Child spans can represent:
model.generate;retrieval.query;tool.call;agent.handoff;approval.wait;state.checkpoint;artifact.validate.
Attributes can include:
- agent name and version;
- workflow and prompt version;
- model identifier;
- tool and server identity;
- task type and risk class;
- status and error category;
- token counts;
- result size;
- retry attempt;
- approval outcome.
Use semantic conventions from OpenTelemetry when they fit. Extend them with organization-specific attributes under a clear namespace. Avoid inventing fields that conflict with evolving GenAI conventions.
Measure outcomes, not only calls
Infrastructure metrics can be healthy while the agent fails users. Add outcome signals:
- task completion;
- correct environment state;
- user correction;
- escalation;
- rollback;
- policy violation;
- duplicate side effect;
- evaluation score on sampled runs.
The outcome may arrive after the trace ends. Link delayed business results back to the task ID and update an outcome store rather than keeping a trace open indefinitely.
Success must be task-specific. A 200 OK from every tool does not prove the final renewal, report, or booking was correct.
Error taxonomy
Use stable categories so teams can aggregate failures:
- model provider;
- invalid model output;
- retrieval miss;
- tool selection;
- invalid arguments;
- authorization;
- approval denied;
- rate limit;
- timeout;
- backend dependency;
- state conflict;
- remote-agent rejection;
- output validation;
- user cancellation.
Preserve the owning component and retryability. “Agent error” is too broad for action.
Distinguish a timeout from a confirmed failure. A side-effecting operation may complete after the client stops waiting, creating an uncertain outcome that requires reconciliation.
Latency and critical path
Agent runs contain serial, parallel, and waiting time.
Measure:
- end-to-end latency;
- active compute time;
- model latency;
- tool and retrieval latency;
- queue time;
- human-approval wait;
- remote-agent duration;
- retries;
- time to first visible progress;
- time to final outcome.
The trace critical path identifies operations that actually determine completion time. Optimizing a parallel call outside that path may not improve user experience.
For long-running agents, emit progress and state events. A two-minute workflow with honest progress may be more usable than a silent 30-second one.
Cost observability
Track cost by run and successful outcome:
- input and output tokens;
- cached-token use where available;
- model calls;
- retrieval and vector operations;
- paid API or tool calls;
- remote-agent charges;
- infrastructure;
- human review.
Cost per call can reward an agent that gives up early. Cost per successful task better connects spending to value.
Use budgets at multiple levels: step, run, user, tenant, and day. Record when a budget stops or degrades a workflow.
Privacy and data minimization
Agent telemetry may include prompts, documents, tool arguments, customer records, and model outputs. Recording everything “for debugging” creates a second sensitive data system.
Define an allowlist:
- which metadata is always retained;
- which payloads may be sampled;
- which fields are redacted or hashed;
- which workflows prohibit payload capture;
- who may access traces;
- how long each class is retained;
- how deletion and legal hold work.
Secrets must be removed before export. Redact authorization headers, cookies, API keys, credentials, and sensitive URL parameters.
Keep tenant boundaries in sampling, storage, and dashboards. An operator’s broad trace access should be a deliberate, audited role.
Model inputs and outputs
Full prompt and completion capture can help reproduce failures, but it carries high privacy and intellectual-property risk. Alternatives include:
- content hashes;
- template and version IDs;
- token counts;
- structured-output validation results;
- bounded, redacted excerpts;
- encrypted payload references;
- opt-in sampling for approved environments.
Do not depend on hidden chain-of-thought. Record observable model outputs and actions the system actually used.
Dashboards that support decisions
Create separate views for:
Product health: task success, escalation, user correction, completion latency.
Agent behavior: steps, tool calls, retries, stopping, sampled eval scores.
Dependencies: model, retrieval, tool, and remote-agent latency and errors.
Cost: spend per task type, tenant, model, tool, and successful outcome.
Safety: permission denials, unapproved-action attempts, redaction failures, policy violations.
Avoid one dashboard with every metric. Each view should answer a clear operational question.
Alerting
Alert on symptoms that require action:
- critical authorization violation;
- duplicate side effect;
- sharp task-success decline;
- sustained dependency error rate;
- p95 latency breach;
- runaway retries or token use;
- missing trace coverage;
- evaluation regression after deployment.
Use rates and windows to reduce noise, but keep zero-tolerance events separate. Include task, component, version, and a safe trace link in the alert.
Sampling strategy
A balanced plan can keep:
- metrics for all runs;
- essential span metadata for all runs;
- full permitted traces for errors and high-risk tasks;
- representative samples of successful runs;
- additional samples after a version change;
- selected payloads only under approved policy.
Tail sampling helps retain slow and failed traces. Coordinate sampling decisions across services so a useful distributed trace is not broken into unrelated fragments.
Deployment and change tracking
Attach version information to every run:
- application and workflow;
- prompt;
- model snapshot and settings;
- retrieval index;
- tool and server;
- policy;
- evaluator.
When success drops, version dimensions turn a vague incident into a comparison. Release annotations on dashboards help connect behavior changes to deployment.
Canary new agent configurations to a controlled cohort. Compare outcome, safety, latency, and cost before broad rollout.
Common mistakes
- Monitoring model latency but not end-to-end success.
- Logging payloads without a data policy.
- Omitting tool and remote-agent provenance.
- Using one generic error category.
- Ignoring approval and waiting time.
- Reporting average latency without percentiles.
- Measuring cost per call instead of per successful task.
- Breaking trace context at async queues.
- Keeping no version metadata.
- Assuming observability automatically provides evaluation or audit guarantees.
My Take
Agent observability should explain the user outcome and the distributed execution in the same vocabulary. If product teams see only task success while platform teams see only API latency, both miss the relationship that matters.
Start with a small, disciplined signal model: one correlated run, stable component spans, explicit state and approval events, task-level outcome, and privacy-safe metrics. Add payloads sparingly. Good observability reduces uncertainty; collecting everything merely moves the uncertainty into a larger, riskier data store.